UX News
A look at what's going on in the field of user experience.
You might be a victim of corrupt personalization
, UX Collective - Medium“Oh, no! I’m getting to watch, hear, and read exactly what I want. Help me! Somebody do something!”
Vibe coding vs. the metaverse: a tale of hollow tech buzzwords
, UX Collective - Medium
One born of modest intent, the other of hype— both now following the same hollow pattern.
Honda Prelude’s Porsche problem
, UX Collective - Medium
When mainstream brands borrow luxury design language, who wins?
How can AI UI capture intent?
, UX Collective - Medium
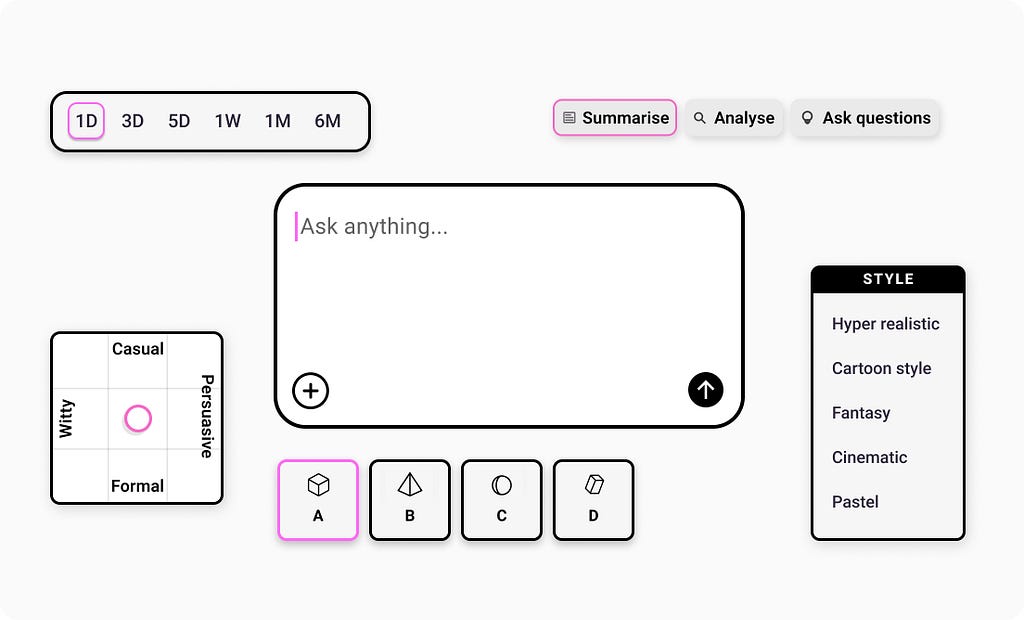
Exploring contextual prompt patterns that capture user intent as it is typedContext management is unarguably one of the most important aspect that provide AI models context to shape their behaviour and results. When users upload documents, ask questions, or provide instructions, they’re essentially teaching AI models how to behave and what outcomes to deliver. Yet despite this fundamental importance, most AI products handle context in surprisingly crude ways.
Current patterns like smart defaults in Claude homepage, context filters in GitHub Copilot or style controls in Adobe Firefly offer a strong starting points but they share a limitation. The smart defaults are either too broad or users must articulate their full intent upfront and then fall back on iterative chat-based back-and-forth to refine context.
5 Image Editing Techniques with Google Nano Banana
, UX Planet - Medium
Image generated in Google Nano Banana (prompt: friendly banana in pixelated style of old games).Google Nano Banana is the codename for Gemini 2.5 Flash Image, the latest image generation & editing model from Google. This model has a few notable features that make it stand out, such as advanced image editing with natural language, character consistency, and easy style transfer (very easy to apply the artistic style, color, or texture from one image to an object in another). If you want to play with this model too, you can do it for free in Google AI Studio.
In this article, I will show you five great examples of how you can edit images using Google Nano Banana (spoiler alert: Nano Banana won’t replace Photoshop, but can save you a lot of time in routine image editing).
A Designer’s Guide to Prompting Google Nano Banana
, UX Planet - Medium
Image generated using Google Nano BananGoogle Nano Banana is the codename for Gemini 2.5 Flash Image, the latest image generation and editing model from Google. It represents a significant upgrade to the image creation capabilities. This model has a few notable features that make it stand out, such as advanced image editing with natural language, character consistency, and easy style transfer (very easy to apply the artistic style, color, or texture from one image to an object in another).
I’ve got a chance to play with Nano Banana and in this article, I want to share 3 prompts that can be helpful for routine design tasks. If you want to play with this model too, you can do it for free in Google AI Studio.
Why Confetti Celebrations Backfire (and How to Make Them Work)
, UX Planet - Medium
We’ve all seen it: the screen explodes with confetti, balloons float across, or a cartoon character throws you a virtual high-five.
It’s meant to feel like a reward. A celebration. A motivational nudge into the next action.
The death of phones: When reality becomes your interface
, UX Planet - Medium
Picture this: You wake up tomorrow and your phone is gone. Not broken, not lost — completely unnecessary. Your smart glasses show…
The User Experience of AI-Based Chat Software (2025)
, MeasuringU
AI is rapidly changing. By the time we write about the latest features and performance benchmarks, they are replaced by newer features and benchmarks.
But are all those features and benchmarks noticed by users? Perhaps.
Verifying the Stability of the Five-Item SUPR-Qm V2
, MeasuringU
We developed the SUPR-Qm® in 2017 to measure the quality of the mobile app experience.
Its original form had 16 items. That is long for a UX questionnaire (e.g., the SUS has ten and the SUPR-Q® has eight). The reason it had 16 items was that it was developed using a technique called Rasch analysis, which, among other things, enables the dynamic presentation of a subset of items from the total set of 16 items.

